
こんにちは、中村です。
Googleから発表された、現在プレビューのConversational Analytics APIはデータ集計と可視化に優れていたため、今回はBigQueryのデータをこれで分析する方法について解説します。
目次
概要
Conversational Analytics APIは、BigQuery・Looker・LookerStudioのデータに対して自然言語でデータ集計ができるAPIです。単発での集計に加えて、エージェントを作成することによって会話をしながらデータの集計・可視化をすることができるのが特徴です。
使ってみた
今回は、Google公式が公開しているColabのサンプルコードをもとに試してみます。(以下のコードはColabで実行することを想定しています。)
準備
今回使うデータは以下の2テーブルです。BigQueryで事前にテーブルにしておきます。
mock_data
架空の売上データ
date,store_id,sales,customers
2025-10-01,1,55000,85
2025-10-01,2,82000,120
2025-10-01,3,31000,45
2025-10-01,4,72000,105
2025-10-01,5,45000,65
2025-10-02,1,61000,92
2025-10-02,2,78000,115
2025-10-02,3,35000,50
2025-10-02,4,85000,125
2025-10-02,5,48000,70
2025-10-03,1,75000,110
2025-10-03,2,95000,135
2025-10-03,3,42000,60
2025-10-03,4,99000,150
2025-10-03,5,55000,80
2025-10-04,1,58000,88
2025-10-04,2,80000,118
2025-10-04,3,33000,48
2025-10-04,4,76000,110
2025-10-04,5,46000,68
2025-10-05,1,65000,100
2025-10-05,2,88000,130
2025-10-05,3,38000,55
2025-10-05,4,90000,140
2025-10-05,5,52000,75
2025-10-06,1,51000,75
2025-10-06,2,75000,105
2025-10-06,3,29000,40
2025-10-06,4,68000,95
2025-10-06,5,43000,60
2025-10-07,1,60000,90
2025-10-07,2,84000,122
2025-10-07,3,36000,52
2025-10-07,4,79000,115
2025-10-07,5,49000,72
2025-10-08,1,68000,105
2025-10-08,2,92000,132
2025-10-08,3,40000,58
2025-10-08,4,95000,145
2025-10-08,5,54000,78
2025-10-09,1,54000,80
2025-10-09,2,77000,110
2025-10-09,3,32000,47
2025-10-09,4,74000,108
2025-10-09,5,44000,63
2025-10-10,1,63000,95
2025-10-10,2,86000,128
2025-10-10,3,37000,54
2025-10-10,4,88000,135
2025-10-10,5,50000,74
2025-10-11,1,70000,108
2025-10-11,2,98000,140
2025-10-11,3,45000,65
2025-10-11,4,105000,160
2025-10-11,5,58000,85
2025-10-12,1,72000,112
2025-10-12,2,102000,145
2025-10-12,3,47000,68
2025-10-12,4,110000,170
2025-10-12,5,60000,90
2025-10-13,1,56000,83
2025-10-13,2,81000,117
2025-10-13,3,30000,43
2025-10-13,4,70000,102
2025-10-13,5,42000,58
2025-10-14,1,62000,94
2025-10-14,2,83000,121
2025-10-14,3,34000,49
2025-10-14,4,77000,112
2025-10-14,5,47000,67
2025-10-15,1,66000,102
2025-10-15,2,89000,131
2025-10-15,3,39000,56
2025-10-15,4,93000,142
2025-10-15,5,53000,77
mock_mst
架空の店舗マスター
store_id,store_name,region,opening_year
1,新宿中央店,関東,2018
2,大阪梅田店,関西,2015
3,名古屋栄店,中部,2020
4,福岡博多店,九州,2019
5,札幌大通店,北海道,2017
6,横浜西口店,関東,2022
7,京都河原町店,関西,2021
8,仙台青葉店,東北,2016
9,広島本通店,中国,2023
10,沖縄那覇店,九州,2014
また今回使うコードは以下です。
まずはインポートと権限について記述してあります。
import json
import json as json_lib

import altair as alt
import pandas as pd
import requests
from IPython.display import HTML, display
from google.colab import auth
from pygments import formatters, highlight, lexers

auth.authenticate_user()

access_token = !gcloud auth application-default print-access-token
headers = {
    "Authorization": f"Bearer {access_token[0]}",
    "Content-Type": "application/json",
}
次にGoogle Cloudのプロジェクトを指定とプロンプトを指定します。
ここでは、system_instruction にプロンプトだけでなく、YAML形式のセマンティックモデルも指定できます。
# @title Billing Project and Prompt (System Instruction)

# fmt: off
billing_project = "[your-project-id]"  # @param {type:"string"}

location = "global"
api_version = "v1beta"

# provide critical context for your Conversational Analytics Agent here
system_instruction = "Think like an Analyst"  # @param {type:"string"}
# fmt: on
system_instructionのテンプレートについて
# system_instruction: エージェントの役割や期待される振る舞いを記述します。例: あなたは販売データのアナリストです。
system_instruction: str

# tables: エージェントが質問に答えるためにアクセスできるデータテーブルのリストです。
tables:
  - # table: 単一の関連テーブルの詳細です。
    table:
      # name: テーブルの名前です。
      name: str
      # description: テーブルが格納するデータの概要です。
      description: str
      # synonyms: テーブルを参照するための代替語句のリストです。
      synonyms: list[str]
      # tags: テーブルに関連付けられたキーワードやタグのリストです。
      tags: list[str]
      # fields: テーブル内のカラム(フィールド)の詳細です。
      fields:
        - # field: 現在のテーブル内の単一のカラムの詳細です。
          field:
            # name: カラムの名前です。
            name: str
            # description: カラムのデータに関する説明です。
            description: str
            # synonyms: カラムを参照するための代替語句のリストです。
            synonyms: list[str]
            # tags: カラムに関連付けられたキーワードやタグのリストです。
            tags: list[str]
            # sample_values: カラムに存在する可能性のあるサンプル値のリストです。
            sample_values: list[str]
            # aggregations: カラムに対して一般的に使用される、またはデフォルトの集計(合計、平均など)のリストです。
            aggregations: list[str]
      # measures: テーブルの計算メトリック(指標)のリストです。
      measures:
        - # measure: テーブル内の単一のメトリックの詳細です。
          measure:
            # name: メトリックの名前です。
            name: str
            # description: メトリックに関する説明です。
            description: str
            # exp: メトリックを構築するために使用される式(SQLなど)です。
            exp: str
            # synonyms: メトリックを参照するための代替語句のリストです。
            synonyms: list[str]
      # golden_queries: テーブルに関する重要または人気のある("ゴールデン")クエリのリストです。
      golden_queries:
        - # golden_query: 単一の重要クエリの詳細です。
          golden_query:
            # natural_language_query: 自然言語での質問です。
            natural_language_query: str
            # sql_query: 自然言語クエリに対応するSQLクエリです。
            sql_query: str
      # golden_action_plans: 特定の質問に答えるための提案されたマルチステッププランのリストです。
      golden_action_plans:
        - # golden_action_plan: 単一のアクションプランの詳細です。
          golden_action_plan:
            # natural_language_query: 自然言語での質問です。
            natural_language_query: str
            # action_plan: このアクションプランの手順のリストです。
            action_plan:
              - # step: アクションプラン内の単一のステップです。
                step: str

# relationships: テーブル間の結合関係のリストです。
relationships:
  - # relationship: 単一の結合関係の詳細です。
    relationship:
      # name: この結合関係の名前です。
      name: str
      # description: 関係の説明です。
      description: str
      # relationship_type: 結合関係のタイプ(one-to-one, one-to-many, many-to-one, many-to-many)です。
      relationship_type: str
      # join_type: 結合のタイプ(inner, outer, left, right, full)です。
      join_type: str
      # left_table: 結合における左側のテーブルの名前です。
      left_table: str
      # right_table: 結合における右側のテーブルの名前です。
      right_table: str
      # relationship_columns: 結合に使用されるカラムのリストです。
      relationship_columns:
        - # left_column: 左側のテーブルからの結合カラムです。
          left_column: str
          # right_column: 右側のテーブルからの結合カラムです。
          right_column: str

# glossaries: 用語、専門用語、略語などのビジネス用語の定義のリストです。
glossaries:
  - # glossary: 単一の用語集項目の定義です。
    glossary:
      # term: 定義する用語、フレーズ、または略語です。
      term: str
      # description: 用語の説明または定義です。
      description: str
      # synonyms: 用語集エントリの代替語句のリストです。
      synonyms: list[str]

# additional_descriptions: 他の場所でカバーされていない、その他の一般的な指示やコンテキストのリストです。
additional_descriptions:
  - # text: 他の場所でカバーされていない、追加の一般的な指示やコンテキストです。
    text: str
次に、BigQueryのデータソース登録とクエリ例の入力部分です。
クエリ例は今回は使いません
# @title BigQuery Datasource

bigquery_data_sources = {
    "bq": {
        "tableReferences": [
            {
                "projectId": "[your-project-id]",
                "datasetId": "nakamura_dataset",
                "tableId": "mock_data",
            },
            {
                "projectId": "[your-project-id]",
                "datasetId": "nakamura_dataset",
                "tableId": "mock_mst",
            },
            # Add more table references here
        ]
    }
}

optional example queries (only leveraged for BigQuery datasources currently)
example_queries = [
    {
        "naturalLanguageQuestion": "What is the highest observed positive longitude?",
        "sqlQuery": "SELECT MAX(longitude) FROM airports",
    },
]
続いて、APIから返されるテキスト・スキーマ・SQL・チャートなどのレスポンスを処理・表示するためのユーティリティ関数群を定義します。
# @title Streaming Chat Messages


def is_json(str):
    try:
        json_object = json_lib.loads(str)
    except ValueError:
        return False
    return True


def handle_text_response(resp):
    parts = resp["parts"]
    print("".join(parts))


def get_property(data, field_name, default=""):
    return data[field_name] if field_name in data else default


def display_schema(data):
    fields = data["fields"]
    df = pd.DataFrame(
        {
            "Column": map(lambda field: get_property(field, "name"), fields),
            "Type": map(lambda field: get_property(field, "type"), fields),
            "Description": map(
                lambda field: get_property(field, "description", "-"), fields
            ),
            "Mode": map(lambda field: get_property(field, "mode"), fields),
        }
    )
    display(df)


def display_section_title(text):
    display(HTML(f"<h2>{text}</h2>"))


def format_bq_table_ref(table_ref):
    return "{}.{}.{}".format(
        table_ref["projectId"], table_ref["datasetId"], table_ref["tableId"]
    )


def format_looker_table_ref(table_ref):
    return "lookmlModel: {}, explore: {}".format(
        table_ref["lookmlModel"], table_ref["explore"]
    )


def display_datasource(datasource):
    source_name = ""

    if "studioDatasourceId" in datasource:
        source_name = datasource["studioDatasourceId"]
    elif "lookerExploreReference" in datasource:
        source_name = format_looker_table_ref(datasource["lookerExploreReference"])
    else:
        source_name = format_bq_table_ref(datasource["bigqueryTableReference"])

    print(source_name)
    display_schema(datasource["schema"])


def handle_schema_response(resp):
    if "query" in resp:
        print(resp["query"]["question"])
    elif "result" in resp:
        display_section_title("Schema resolved")
        print("Data sources:")
        for datasource in resp["result"]["datasources"]:
            display_datasource(datasource)


def handle_data_response(resp):
    if "query" in resp:
        query = resp["query"]
        display_section_title("Retrieval query")
        print("Query name: {}".format(query["name"]))
        print("Question: {}".format(query["question"]))
        print("Data sources:")
        for datasource in query["datasources"]:
            display_datasource(datasource)
    elif "generatedSql" in resp:
        display_section_title("SQL generated")
        print(resp["generatedSql"])
    elif "result" in resp:
        display_section_title("Data retrieved")

        fields = map(
            lambda field: get_property(field, "name"),
            resp["result"]["schema"]["fields"],
        )
        dict = {}

        for field in fields:
            dict[field] = [get_property(el, field) for el in resp["result"]["data"]]

        display(pd.DataFrame(dict))


def handle_chart_response(resp):
    if "query" in resp:
        print(resp["query"]["instructions"])
    elif "result" in resp:
        vegaConfig = resp["result"]["vegaConfig"]
        alt.Chart.from_json(json_lib.dumps(vegaConfig)).display()


def handle_error(resp):
    display_section_title("Error")
    print("Code: {}".format(resp["code"]))
    print("Message: {}".format(resp["message"]))


def get_stream(url, json):
    s = requests.Session()

    acc = ""

    with s.post(url, json=json, headers=headers, stream=True) as resp:
        for line in resp.iter_lines():
            if not line:
                continue

            decoded_line = str(line, encoding="utf-8")

            if decoded_line == "[{":
                acc = "{"
            elif decoded_line == "}]":
                acc += "}"
            elif decoded_line == ",":
                continue
            else:
                acc += decoded_line

            if not is_json(acc):
                continue

            data_json = json_lib.loads(acc)

            if "systemMessage" not in data_json:
                if "error" in data_json:
                    handle_error(data_json["error"])
                continue

            if "text" in data_json["systemMessage"]:
                handle_text_response(data_json["systemMessage"]["text"])
            elif "schema" in data_json["systemMessage"]:
                handle_schema_response(data_json["systemMessage"]["schema"])
            elif "data" in data_json["systemMessage"]:
                handle_data_response(data_json["systemMessage"]["data"])
            elif "chart" in data_json["systemMessage"]:
                handle_chart_response(data_json["systemMessage"]["chart"])
            else:
                colored_json = highlight(
                    acc, lexers.JsonLexer(), formatters.TerminalFormatter()
                )
                print(colored_json)
            print("\n")
            acc = ""
以下が分析依頼を行う部分です。
# @title [Stateless] Chat using Inline Context

chat_url = f"https://geminidataanalytics.googleapis.com/{api_version}/projects/{billing_project}/locations/global:chat"

# fmt: off
question = "Show the schema of datasource"  # @param {type:"string"}
# fmt: on

# Construct the payload
chat_payload = {
    "parent": f"projects/{billing_project}/locations/global",
    "messages": [{"userMessage": {"text": question}}],
    "inline_context": {
        "datasource_references": bigquery_data_sources,
        "options": {
            "analysis": {
                # Optional - if wanting to use advanced analysis with python
                "python": {"enabled": True}
            }
        },
    },
}

# Call get_stream method to stream the response
get_stream(chat_url, chat_payload)
実際に使ってみる
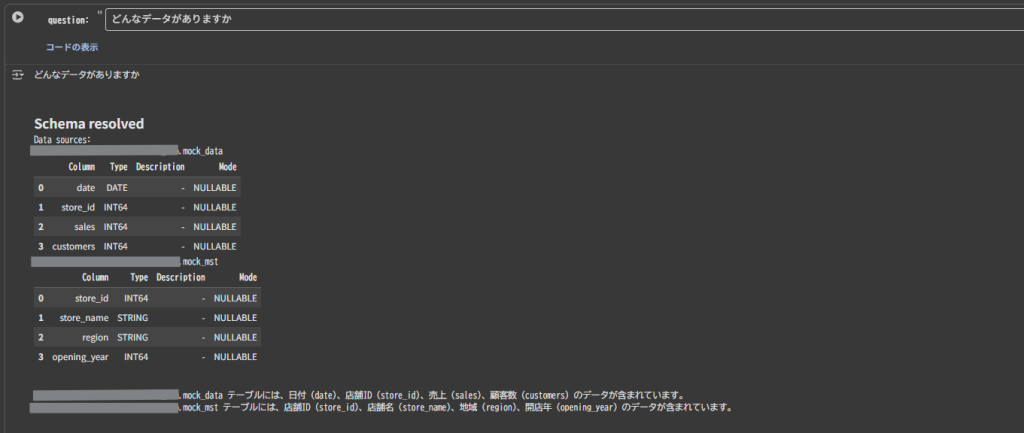
1.プロンプト:どんなデータがありますか
まずは、分析前にどのようなデータが含まれているのか確認してみましょう。
結果
mock_data テーブルには、日付 (date)、店舗ID (store_id)、売上 (sales)、顧客数 (customers) のデータが含まれています。 mock_mst テーブルには、店舗ID (store_id)、店舗名 (store_name)、地域 (region)、開店年 (opening_year) のデータが含まれています。
今回はsystem_instructionにカラムの説明を設定していないため、列名から回答が生成されているようです。
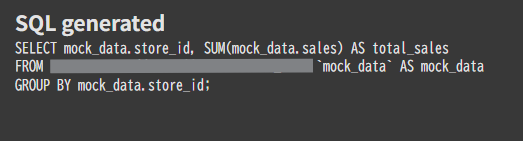
2.プロンプト:店舗IDごとの売り上げを教えてください
続いて単体のテーブルで回答できるプロンプトを投げます。
生成されたSQL
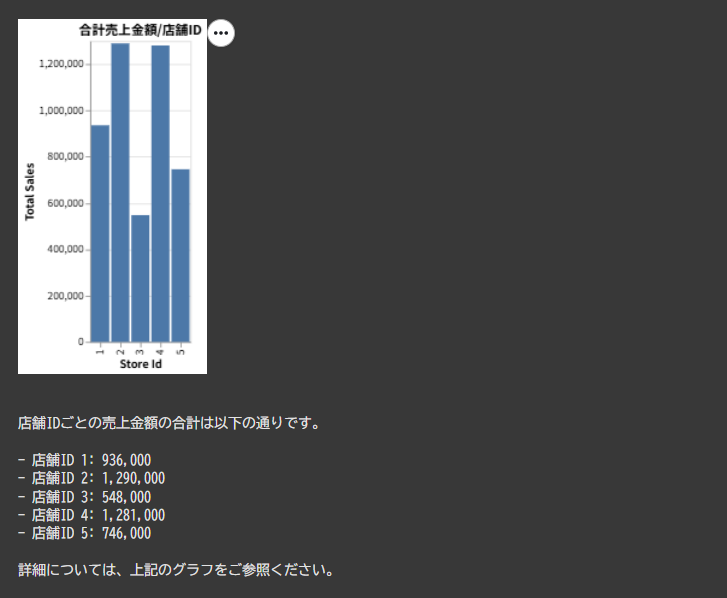
結果
シンプルな集計内容だったこともあり、正確な結果が返されました。
(グラフが作成できる場合にはVega-Liteで応答がかえってくるため、handle_chart_response()で描画しています。)
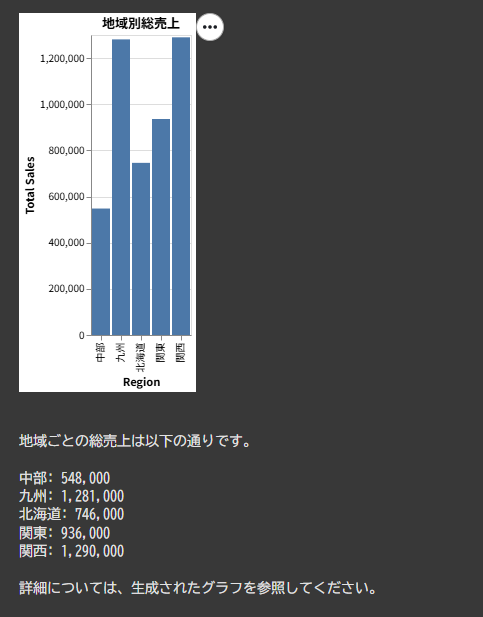
3.プロンプト:地域ごとの売り上げを出してください
今度は、複数テーブルを参照する必要があるプロンプトを投げます。system_instructionでリレーション情報は与えていない状態です。
生成されたSQL
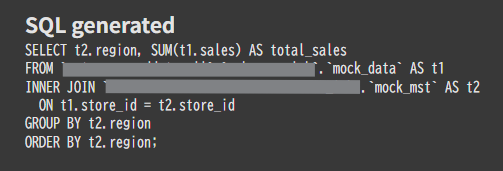
結果
リレーションを正しく推定し、正確に集計できました。
まとめ
今回はConversational Analytics APIを使った分析をしてみました。
グラフの出力などもできるのがうれしいですね。
皆さんもぜひ使ってみてください!